Introduction
In an era where digital transformation is reshaping industries at an unprecedented pace, the importance of robust cybersecurity measures cannot be overstated. As the VP of Corporate Marketing and Research at Kiteworks, I am pleased to present our comprehensive “2024 Risk Score Report,” a critical analysis of the evolving cybersecurity landscape across various sectors.
Introduction
Dear Readers,
In an era where digital transformation is reshaping industries at an unprecedented pace, the importance of robust cybersecurity measures cannot be overstated. As the VP of Corporate Marketing and Research at Kiteworks, I am pleased to present our comprehensive “2024 Risk Score Report,” a critical analysis of the evolving cybersecurity landscape across various sectors.
This report comes at a crucial time when organizations worldwide are grappling with increasingly sophisticated cyber threats. The data breaches we’ve witnessed in recent years are not just growing in frequency but also in their scale and impact. From healthcare to finance, education to retail, no sector is immune to these digital vulnerabilities. Our analysis reveals a consistent upward trend in Risk Scores across industries, underlining the urgent need for enhanced cybersecurity strategies.
What sets this report apart is our innovative Risk Score methodology. By providing a standardized, quantifiable measure of cybersecurity risk, we offer decision-makers a powerful tool for benchmarking their organization’s security posture against industry peers and tracking progress over time. This approach enables more informed strategic planning and resource allocation in the fight against cyber threats.
In the following pages, you’ll find detailed analyses of individual sectors, trends in data compromises and their impacts, and insights into emerging cybersecurity challenges. We also explore the potential future applications of our Risk Score methodology, from predictive modeling to regulatory compliance. It is our hope that this report will not only raise awareness of the current cybersecurity landscape but also inspire proactive measures to build more resilient digital ecosystems across all industries.
Sincerely,
Patrick Spencer
Patrick Spencer, Ph.D.
VP of Corporate Marketing and Research
Kiteworks
Key Takeaways
Risk Scores Across Industries (1H 2024 – 2018)
| Industry | 1H 2024 | 2023 | 2022 | 2021 | 2020 | 2019 | 2018 |
|---|---|---|---|---|---|---|---|
| Overall | 7.3 | 7.3 | 6.0 | 6.2 | 5.4 | 5.3 | 5.1 |
| Education | 3.2 | 7.2 | 5.0 | 5.1 | 4.8 | 5.4 | 4.6 |
| Financial Services | 5.9 | 8.5 | 6.2 | 4.6 | 6.0 | 6.4 | 5.8 |
| Government | 6.7 | 7.9 | 4.0 | 6.3 | 5.5 | 4.8 | 4.4 |
| Healthcare | 5.4 | 8.2 | 5.4 | 5.0 | 6.8 | 5.9 | 5.3 |
| Hospitality | 10.0 | 7.4 | 5.2 | 5.8 | 5.1 | 4.9 | 4.5 |
| Manufacturing | 8.6 | 5.8 | 4.9 | 3.8 | 4.3 | 4.6 | 5.0 |
| Professional Services | 3.5 | 6.0 | 4.5 | 6.4 | 5.2 | 5.8 | 5.4 |
| Retail | 9.1 | 6.3 | 3.6 | 7.2 | 5.7 | 5.3 | 4.9 |
| Technology | 3.8 | 7.4 | 5.7 | 5.3 | 4.9 | 5.2 | 4.7 |
| Transportation | 3.0 | 6.7 | 5.8 | 5.5 | 5.3 | 5.6 | 4.8 |
| Utilities | 4.7 | 7.0 | 4.3 | 4.8 | 4.0 | 5.6 | 5.1 |
Table 1: 1H 2024 – 2018 Risk Scores.
1. Overall Risk Score Increase: The average Risk Score across all industries rose from 6.0 in 2022 to 7.3 in 2023, marking a 21.7% increase. This significant jump reflects the growing cybersecurity challenges faced by organizations across sectors.
2. Financial Services Sector Most at Risk: In 2023, the financial services sector had the highest Risk Score of 8.5, up from 6.2 in 2022, indicating it faces the most severe cybersecurity threats among all industries analyzed.
3. Government Sector’s Dramatic Surge: The government sector experienced the most dramatic Risk Score increase over a five-year period, rising from 4.0 in 2022 to 7.9 in 2023, a 97.5% increase, highlighting rapidly escalating cyber risks in this sector.
4. Hospitality’s Recent Vulnerability: The hospitality sector showed the most alarming short-term trend, with its Risk Score skyrocketing from 4.3 in 1H 2023 to 10.0 in 1H 2024, a 132.6% increase in just one year.
5. Technology Sector’s Improved Position: Despite its critical role in the digital landscape, the technology sector saw a significant Risk Score decrease from 7.6 in 1H 2023 to 3.8 in 1H 2024, suggesting improved cybersecurity measures in this industry.
6. Manufacturing’s Emerging Risks: The manufacturing sector’s Risk Score more than doubled from 3.9 in 1H 2023 to 8.6 in 1H 2024, indicating rapidly growing cybersecurity challenges in this traditionally less-targeted industry.
Growing Threat of Data Breaches
Data breaches have emerged as a critical threat to organizations across all sectors, which is exacerbated in an era of digital transformation and interconnectedness. One challenge is the landscape of cybersecurity is constantly evolving, with attackers employing increasingly sophisticated methods to exploit vulnerabilities in our digital infrastructure. This report aims to shed light on the current state of data breaches, their far-reaching impacts, and the pressing need for advanced risk assessment tools to combat this growing menace.
Overview of the Current Data Breach Landscape
- Recent High-profile Data Breaches: Since late 2023, data breaches have escalated into an even more critical issue for both organizations and individuals, with the U.S. alone reporting a staggering 3,205 data compromises affecting over 353 million individuals.1 T-Mobile, a repeat target, suffered several breaches throughout the year, compromising sensitive data from both customers and employees. The healthcare sector, already a prime target for cybercriminals, saw millions of patient records exposed, exacerbating the industry’s ongoing struggle to protect sensitive information.
At the same time, the rise of ransomware and supply chain attacks continued unabated, with the frequency of vulnerabilities exploited as entry points nearly tripling from the previous year. Risks associated with the software supply chain hit new heights in 2023; the MOVEit managed file transfer attack by the Russian cybercriminal group Clop impacted over 2,600 organizations and upwards of 89 million data records were breached.2 Finally, despite growing awareness, human error remains a persistent vulnerability, with 74% of breaches involving non-malicious human actions, such as social engineering attacks and unintentional mistakes, highlighting the need for more robust security practices and training.3
- Global Statistics on Data Breach Frequency and Impact: The frequency and scale of data breaches have reached alarming levels. According to the latest Identity Theft Resource Center (ITRC) “Global Data Breach Report,” there were 3,205 publicly reported data breaches in 2023, a 15% increase from the previous year.4 More concerning is the volume of records exposed—an estimated 22 billion, marking a 30% jump from 2022. The average time to identify and contain a breach also increased to 287 days, indicating the growing complexity of cyberattacks.
Economic Impact of Data Breaches
The financial repercussions of data breaches are staggering and multifaceted, encompassing both direct and indirect costs.
- Direct Costs (e.g., financial losses, legal fees): The immediate financial impact of a data breach can be severe. The average cost of a data breach reached $4.88 million over the past year, a 10% increase.5 This figure includes expenses related to breach detection and response, legal fees, regulatory fines, and customer notification costs. Notable is the rise in ransomware-related breaches, with the average ransomware demand hitting $5.2 million in the first half of this year6 and Sophos indicating ransomware payments shot up 500% to $2 million.7
- Indirect Costs (e.g., reputation damage, loss of customer trust): Beyond the quantifiable financial losses, data breaches can inflict long-lasting damage to an organization’s reputation and customer relationships. A recent study found that 65% of consumers lose trust in a company following a data breach, with 85% stating they would not do business with a company if they had concerns about its security practices.8 Data breaches also have a long-tail legal impact. Kiteworks, in its “2024 Sensitive Content Communications Privacy and Compliance Report,” found that six in 10 organizations spend more than $2 million every year to deal with the legal costs of both internal and external data loss incidents, with 45% spending over $3 million.9 Indeed, when these factors are considered, the long-term impact on brand value and customer loyalty can far outweigh the immediate financial losses.
Need for Robust Risk Assessment
In the face of these evolving and intensifying threats, traditional risk assessment methods are proving inadequate. Organizations need more sophisticated, data-driven tools to accurately gauge their vulnerability to data breaches and prioritize their cybersecurity investments.
Robust risk assessment tools are crucial for:
- Identifying vulnerabilities across an organization’s entire digital ecosystem
- Quantifying potential financial and reputational impacts of a breach
- Benchmarking security posture against industry peers and best practices
- Informing strategic decisions on resource allocation for cybersecurity measures
- Demonstrating due diligence to regulators, stakeholders, and customers
As we delve deeper into this report, we will explore a new approach to risk assessment—a Data Breach Risk Score Index. This standardized metric aims to provide organizations with a comprehensive, actionable insight into their data breach risk, enabling more effective strategies for breach prevention and mitigation in an increasingly perilous digital landscape.
Need for a Standardized Risk Score
As organizations grapple with the ever-present threat of data breaches, the ability to accurately assess and compare risk becomes paramount. However, the current landscape of risk assessment is fraught with inconsistencies and limitations, hampering efforts to develop comprehensive cybersecurity strategies. This section explores the challenges in existing risk assessment methods and presents the case for a standardized data breach Risk Score.
Challenges in Comparing Risk Across Industries and Time
One of the primary obstacles in assessing data breach risk across different sectors is the lack of uniform reporting standards. This challenge is compounded by the existence of over 200 data privacy regulations globally, each with its own unique requirements and specifications.10 These regulations differ in scope, enforcement mechanisms, and the rights they grant to individuals.
Different industries and regions also have disparate requirements for what constitutes a reportable breach, when it should be reported, and what details must be disclosed. For instance, consider the following:
- The healthcare sector in the United States, governed by HIPAA, requires reporting of breaches affecting 500 or more individuals within 60 days.
- The EU’s GDPR mandates reporting of certain breaches within 72 hours, regardless of the number of individuals affected.
- Many industries have no specific reporting requirements, leading to inconsistent and often delayed disclosures.
In the United States alone, 20 states have passed comprehensive data privacy laws, with more states considering similar legislation. These laws differ in various aspects, including scope and applicability thresholds, consumer rights (e.g., right to delete, right to correct), opt-in vs. opt-out requirements for data processing, and enforcement mechanisms and penalties. For example, while California’s CCPA/CPRA grants consumers the right to opt out of the sale of their personal information, Virginia’s CDPA requires opt-in consent for processing sensitive data.
Development of a Risk Score Algorithm
The creation of a standardized Risk Score requires a carefully designed algorithm that balances comprehensiveness with practicality. This section outlines the development process of our Risk Score algorithm, detailing its objectives, components, methodology, and interpretation guidelines.
Objectives of the Score
The Risk Score is designed with three primary objectives in mind:
- Comprehensive Risk Assessment: The Risk Score aims to provide a holistic view of an organization’s data breach risk by incorporating multiple facets of cybersecurity vulnerabilities and their potential impacts. It goes beyond mere technical assessments to include factors that reflect the real-world consequences of data breaches.
- Comparability Across Industries and Time: A key goal of the Risk Score is to enable meaningful comparisons both between different industries and across various time periods. This comparability is crucial for benchmarking and trend analysis, allowing organizations to contextualize their risk level within the broader cybersecurity landscape.
- Actionable Insights for Risk Mitigation: Beyond providing a numeric value, the Risk Score is designed to offer actionable insights. By breaking down the score into its component parts, organizations can identify specific areas of vulnerability and prioritize their risk mitigation efforts effectively.
Components of the Risk Score
The Risk Score is composed of four key components, each chosen for its ability to reflect different aspects of data breach risk:
- Number of Compromises: This component represents the frequency of data breach incidents. A higher number of compromises indicates a greater vulnerability in an organization’s security measures.
- Number of Victims: This factor reflects the scale of data breaches. A larger number of affected individuals suggests more severe breaches with potentially greater impact.
- Victims per Compromise Ratio: This ratio provides insight into the average severity of breaches. A higher ratio indicates that when breaches occur, they tend to affect a larger number of individuals.
- Cost of Data Breach: This component incorporates the financial impact of data breaches, including both direct and indirect costs. It helps to quantify the economic risk associated with potential breaches.
Risk Score Index Methodology
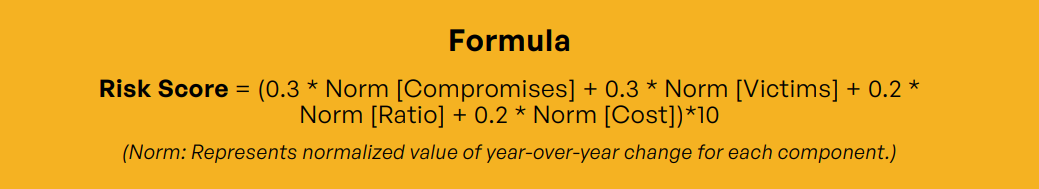
The Risk Score is calculated using a systematic methodology that ensures consistency and comparability:
- Data Normalization Techniques: To account for variations in scale across different organizations and industries, we employ percentile-based normalization for each component. This technique ranks each value within its dataset and converts this rank into a percentile (ranging from 0 to 1), allowing for fair comparisons across different scales.
- Weighting of Components: Each component is assigned a specific weight based on its perceived importance in contributing to overall risk:
- Number of compromises: 30%
- Number of victims: 30%
- Victims per compromise ratio: 20%
- Cost of data breach: 20%
These weights were determined through consultation with cybersecurity experts and analysis of historical breach data.
- Calculation Process: The Risk Score is calculated using the following steps:

Calculate year-over-year changes for each component.

Apply percentile-based normalization to these changes.

Multiply each normalized value by its assigned weight.

Sum the weighted values.

Multiply the sum by 10 to scale the final score to a range of 1-10.
Interpretation of the Risk Score
- Score Range and Meaning
The Risk Score ranges from 1 to 10, with higher scores indicating greater risk:
It is important to note that these categories are relative. Even a “Low Risk” score requires continued vigilance in today’s cybersecurity landscape.
- Comparative Analysis Guidelines
When interpreting Risk Scores:- Compare scores within the same industry to benchmark against peers.
- Analyze scores over time to identify trends in an organization’s risk profile.
- Examine the individual components of the score to identify specific areas of vulnerability.
- Consider the score in conjunction with other risk assessment tools and industry-specific factors.
- Use the score as a starting point for more in-depth risk analysis and mitigation planning.
Four Data Elements Comprising the Risk Score
This section presents the results of applying our Risk Score algorithm to ITRC data from the first half of 2024, 2023, and 2022 as well as 2023 – 2018. By analyzing this recent data, we aim to provide insights into current cybersecurity trends and emerging patterns across various industries.
NOTE: All the industry data compromises and victims do not equal total data compromises and victims because several underrepresented industry sectors as well as unknown and other were excluded.
Data Compromises: 1H 2024 – 1H 2022 and 2023 – 2018
| Sector | 1H 2024 Compromises | 1H 2023 Compromises | 1H 2022 Compromises |
|---|---|---|---|
| Total | 1,571 | 1,382 | 817 |
| Education | 76 | 80 | 41 |
| Financial Services | 407 | 243 | 128 |
| Government | 74 | 50 | 33 |
| Healthcare | 236 | 377 | 160 |
| Hospitality | 33 | 23 | 11 |
| Manufacturing | 151 | 112 | 115 |
| Professional Services | 178 | 137 | 94 |
| Retail | 46 | 57 | 30 |
| Technology | 66 | 87 | 31 |
| Transportation | 54 | 36 | 19 |
| Utilities | 34 | 22 | n/a |
Table 2: 1H 2024, 2023, and 2022 Data Compromises.
| Sector | 2023 | 2022 | 2021 | 2020 | 2019 | 2018 |
|---|---|---|---|---|---|---|
| Overall | 2,734 | 1,376 | 1,628 | 1,440 | 1,250 | 1,090 |
| Education | 173 | 99 | 150 | 125 | 100 | 90 |
| Financial Services | 744 | 269 | 210 | 185 | 150 | 120 |
| Government | 105 | 72 | 95 | 90 | 85 | 80 |
| Healthcare | 809 | 343 | 350 | 290 | 250 | 220 |
| Hospitality | 67 | 34 | 35 | 30 | 25 | 20 |
| Manufacturing | 259 | 249 | 220 | 205 | 190 | 180 |
| Professional Services | 308 | 223 | 315 | 290 | 250 | 200 |
| Retail | 167 | 87 | 130 | 125 | 110 | 100 |
| Technology | 71 | 0 | 60 | 55 | 50 | 45 |
| Utilities | 53 | 0 | 60 | 45 | 40 | 35 |
Table 3: 2023 – 2018 Data Compromises.
Data Compromises: 1H 2024 – 1H 2022 and 2023 – 2018
| Sector | 1H 2024 Victims | 1H 2023 Victims | 1H 2022 Victims |
|---|---|---|---|
| Total | 1,077,048,249 | 179,799,326 | 57,723,887 |
| Education | 722,460 | 1,656,813 | 405,493 |
| Financial Services | 28,414,934 | 41,494,053 | 22,486,993 |
| Government | 9,376,758 | 11,079,145 | 810,529 |
| Healthcare | 26,885,828 | 25,025,229 | 13,127,906 |
| Hospitality | 564,245,892 | 428,360 | 77,761 |
| Manufacturing | 50,428,176 | 1,380,637 | 490,535 |
| Professional Services | 1,265,261 | 12,957,365 | 3,346,048 |
| Retail | 384,019,001 | 6,142,588 | 325,530 |
| Technology | 8,096,887 | 30,965,930 | 15,807,269 |
| Transportation | 1,680,013 | 11,157,924 | 845,823 |
| Utilities | 1,566,546 | 37,377,449 | n/a |
Table 4: 1H 2024, 2023, and 2022 Victims.
| Sector | 2023 | 2022 | 2021 | 2020 | 2019 | 2018 |
|---|---|---|---|---|---|---|
| Total | 237,519,000 | 407,000,000 | 209,480,000 | 186,940,000 | 165,390,000 | 146,350,000 |
| Education | 4,000,000 | 2,000,000 | 3,000,000 | 2,500,000 | 2,000,000 | 1,500,000 |
| Financial Services | 61,000,000 | 27,000,000 | 50,000,000 | 45,000,000 | 40,000,000 | 35,000,000 |
| Government | 10,000,000 | 1,000,000 | 8,000,000 | 7,000,000 | 6,000,000 | 5,000,000 |
| Healthcare | 56,000,000 | 28,000,000 | 48,000,000 | 42,000,000 | 38,000,000 | 36,000,000 |
| Hospitality | 3,000,000 | 1,500,000 | 2,500,000 | 2,000,000 | 1,500,000 | 1,000,000 |
| Manufacturing | 5,000,000 | 24,000,000 | 15,000,000 | 13,000,000 | 11,000,000 | 9,000,000 |
| Professional Services | 30,000,000 | 6,000,000 | 20,000,000 | 18,000,000 | 15,000,000 | 12,000,000 |
| Retail | 65,000,000 | 249,000,000 | 60,000,000 | 55,000,000 | 50,000,000 | 45,000,000 |
| Technology | 222,000 | n/a | 200,000 | 180,000 | 150,000 | 130,000 |
| Utilities | 297,000 | n/a | 280,000 | 260,000 | 240,000 | 220,000 |
Table 5: 2023 – 2018 Data Victims.
| Sector | 2023 vs. 2022 | 2022 vs. 2021 | 2021 vs. 2020 | 2020 vs. 2019 | 2019 vs. 2018 |
|---|---|---|---|---|---|
| Overall | -71.35% | 48.53% | 10.76% | 11.53% | 11.51% |
| Education | 50.00% | -50.00% | 16.67% | 20.00% | 25.00% |
| Financial Services | 55.74% | -85.19% | 10.00% | 11.11% | 12.50% |
| Government | 90.00% | -700.00% | 12.50% | 14.29% | 16.67% |
| Healthcare | 50.00% | -71.43% | 12.50% | 9.52% | 5.26% |
| Hospitality | 50.00% | -66.67% | 20.00% | 25.00% | 33.33% |
| Manufacturing | -380.00% | 37.50% | 13.33% | 15.38% | 18.18% |
| Professional Services | 80.00% | -233.33% | 10.00% | 16.67% | 20.00% |
| Retail | -283.08% | 75.90% | 8.33% | 9.09% | 10.00% |
| Technology | n/a | n/a | 10.00% | 16.67% | 13.33% |
| Utilities | n/a | n/a | 7.14% | 7.69% | 8.33% |
Table 6: 2023 – 2018 Data Victims Increase/Decrease.
Victims per Data Compromise: 1H 2024 – 1H 2022 and 2023 – 2018
| Sector | 1H 2024 Victims per Compromise | 1H 2023 Victims per Compromise | 1H 2022 Victims per Compromise |
|---|---|---|---|
| Total | 760,091 | 142,698 | 87,196 |
| Education | 9,506 | 201,710 | 9,890 |
| Financial Services | 69,816 | 170,757 | 175,680 |
| Government | 126,713 | 221,583 | 24,561 |
| Healthcare | 113,923 | 66,380 | 82,049 |
| Hospitality | 17,098,360 | 18,624 | 7,069 |
| Manufacturing | 333,961 | 12,327 | 4,266 |
| Professional Services | 7,108 | 94,579 | 35,596 |
| Retail | 8,348,239 | 107,765 | 10,851 |
| Technology | 122,680 | 355,930 | 509,912 |
| Transportation | 31,111 | 309,942 | 44,517 |
| Utilities | 46,075 | 1,698,975 | n/a |
Table 7: 1H 2024, 2023, and 2022 Victims per Data Compromise.
| Sector | 2023 | 2022 | 2021 | 2020 | 2019 | 2018 |
|---|---|---|---|---|---|---|
| Overall | 86,876 | 295,785 | 128,673 | 129,819 | 132,312 | 134,266 |
| Education | 23,121 | 20,202 | 20,000 | 20,000 | 20,000 | 16,667 |
| Financial Services | 81,989 | 100,372 | 238,095 | 243,243 | 266,667 | 291,667 |
| Government | 95,238 | 13,889 | 84,211 | 77,778 | 70,588 | 62,500 |
| Healthcare | 69,221 | 81,633 | 137,143 | 144,828 | 152,000 | 163,636 |
| Hospitality | 44,776 | 44,118 | 71,429 | 66,667 | 60,000 | 50,000 |
| Manufacturing | 19,305 | 96,386 | 68,182 | 63,415 | 57,895 | 50,000 |
| Professional Services | 97,403 | 26,906 | 63,492 | 62,069 | 60,000 | 60,000 |
| Retail | 389,222 | 2,862,069 | 461,538 | 440,000 | 454,545 | 450,000 |
| Technology | 3,127 | n/a | 3,333 | 3,273 | 3,000 | 2,889 |
| Utilities | 5,604 | n/a | 4,667 | 5,778 | 6,000 | 6,286 |
Table 8: 2023 – 2018 Victims per Data Compromise.
Average Cost of a Data Breach
The following data comes from IBM’s annual “Cost of a Data Breach Report” and comprises the fourth of the four data components in the algorithm.
| Sector | 2024 | 2023 | 2022 | 2021 | 2020 | 2019 | 2018 |
|---|---|---|---|---|---|---|---|
| Total | $4,880,000 | $4,450,000 | $4,350,000 | $4,240,000 | $3,860,000 | $3,920,000 | $3,860,000 |
| Education | $3,480,000 | $2,960,000 | $3,280,000 | $3,270,000 | $2,010,000 | $1,840,000 | $1,160,000 |
| Financial Services | $5,560,000 | $4,730,000 | $4,470,000 | $4,240,000 | $4,990,000 | $5,200,000 | $1,520,000 |
| Government | $4,880,000 | $4,450,000 | $4,350,000 | $4,240,000 | $3,860,000 | $3,920,000 | $3,860,000 |
| Healthcare | $6,080,000 | $5,900,000 | $5,970,000 | $5,720,000 | $5,850,000 | $5,860,000 | $2,060,000 |
| Hospitality | $3,500,000 | $3,650,000 | $3,860,000 | $3,790,000 | $3,900,000 | $4,770,000 | $1,660,000 |
| Manufacturing | $5,450,000 | $4,660,000 | $4,970,000 | $4,880,000 | $5,040,000 | $5,050,000 | $1,700,000 |
| Pharmaceuticals | $5,080,000 | $4,470,000 | $4,700,000 | $4,650,000 | $4,230,000 | $4,620,000 | $1,810,000 |
| Professional Services | $4,430,000 | $4,180,000 | $3,590,000 | $3,750,000 | $3,580,000 | $3,770,000 | $1,280,000 |
| Retail | $2,550,000 | $2,600,000 | $2,070,000 | $1,930,000 | $1,080,000 | $1,290,000 | $750,000 |
| Technology | $5,290,000 | $4,780,000 | $4,720,000 | $4,650,000 | $6,390,000 | $5,600,000 | $1,670,000 |
| Transportation | $3,820,000 | $3,630,000 | $2,940,000 | $2,030,000 | $1,720,000 | $1,990,000 | $1,200,000 |
| Utilities | $5,100,000 | $4,820,000 | $5,010,000 | $5,040,000 | $5,060,000 | $5,200,000 | $1,740,000 |
Table 9: 2024 – 2018 Average Cost of a Data Breach Across Industries.
Risk Score Calculations for Each Industry
Risk Scores: 1H 2024, 1H 2023, and 1H 2022
Using the methodology outlined in Section III, we calculated Risk Scores for each industry for two comparative periods: 2024 vs. 2023 and 2023 vs. 2022.
| Sector | 1H 2024 Risk Score | 1H 2023 Risk Score | 1H 2022 Risk Score |
|---|---|---|---|
| Total | 7.3 | 6.6 | 6.2 |
| Education | 3.2 | 7.1 | 5.3 |
| Financial Services | 5.9 | 6.8 | 7.4 |
| Government | 6.7 | 8.2 | 4.1 |
| Healthcare | 5.4 | 6.4 | 6.7 |
| Hospitality | 10.0 | 4.3 | 3.5 |
| Manufacturing | 8.6 | 3.9 | 3.7 |
| Professional Services | 3.5 | 6.9 | 5.6 |
| Retail | 9.1 | 6.1 | 3.8 |
| Technology | 3.8 | 7.6 | 8.3 |
| Transportation | 3.0 | 7.3 | 5.9 |
| Utilities | 4.7 | n/a | n/a |
Table 10: 1H 2024, 1H 2023, and 1H 2022 Risk Scores.
Risk Scores: 2023 – 2018
Additionally, using our established methodology, we calculated the Risk Scores for each industry for 2023 to 2018:
| Sector | 2023 | 2022 | 2021 | 2020 | 2019 | 2018 |
|---|---|---|---|---|---|---|
| Overall | 7.3 | 6.0 | 6.2 | 5.4 | 5.3 | 5.1 |
| Education | 7.2 | 5.0 | 5.1 | 4.8 | 5.4 | 4.6 |
| Financial Services | 8.5 | 6.2 | 4.6 | 6.0 | 6.4 | 5.8 |
| Government | 7.9 | 4.0 | 6.3 | 5.5 | 4.8 | 4.4 |
| Healthcare | 8.2 | 5.4 | 5.0 | 6.8 | 5.9 | 5.3 |
| Hospitality | 7.4 | 5.2 | 5.8 | 5.1 | 4.9 | 4.5 |
| Manufacturing | 5.8 | 4.9 | 3.8 | 4.3 | 4.6 | 5.0 |
| Professional Services | 6.0 | 4.5 | 6.4 | 5.2 | 5.8 | 5.4 |
| Retail | 6.3 | 3.6 | 7.2 | 5.7 | 5.3 | 4.9 |
| Technology | 7.4 | 5.7 | 5.3 | 4.9 | 5.2 | 4.7 |
| Transportation | 6.7 | 5.8 | 5.5 | 5.3 | 5.6 | 4.8 |
| Utilities | 7.0 | 4.3 | 4.8 | 4.0 | 5.6 | 5.1 |
Table 11: 2023 – 2018 Risk Scores Across Industries.
Data Insights and Trends
Risk Score and Data in Aggregate
The total number of data compromises shows a consistent upward trend over the observed periods, indicating a rapidly growing number of cybersecurity incidents across all sectors. From 1H 2022 to 1H 2023, there was a significant increase of 69.16% in the number of compromises, followed by a further 13.68% increase from 1H 2023 to 1H 2024. This results in a substantial overall increase of 92.29% from 1H 2022 to 1H 2024. Even more striking is the exponential growth in the total number of victims affected by these compromises. The number of victims increased by 194.50% from 1H 2022 to 1H 2023, and then skyrocketed by 490.76% from 1H 2023 to 1H 2024, culminating in a staggering 1639.75% increase in total victims from 1H 2022 to 1H 2024. The Victims per Compromise metric further emphasizes this trend, showing a 74.10% increase from 1H 2022 to 1H 2023, followed by a 419.69% surge from 1H 2023 to 1H 2024, resulting in an overall 804.76% increase from 1H 2022 to 1H 2024.
These figures paint a concerning picture of not only more frequent cyberattacks but also of attacks that are increasingly large in scale and impact, affecting a dramatically higher number of individuals per incident. When the Risk Score is examined across industries and a six-year time frame, some interesting insights emerge. The overall Risk Score in 2023 now stands at 7.2, up from 5.9 in 2022, an 18% increase. This spike reflects not only the growing complexity of cyberattacks but also the broader operational impacts such as financial losses, reputational damage, and regulatory scrutiny. Data from IBM’s “Cost of a Data Breach Report” corroborates this rise, which revealed a 10% increase in the average global cost of a data breach, now at $4.88 million.11 This trend underscores the urgent need for enhanced cybersecurity measures and preparedness across all industries to mitigate the growing risks and potential damages of data breaches.
Industry Risk Score and Analysis
Education
The education sector has experienced a significant upward trajectory in its Risk Score over the past six years, reflecting its growing exposure to cyberattacks as digital tools and remote learning technologies become more widespread. In 2018, the Risk Score for education was relatively low at 4.2. However, it has steadily increased year over year, reaching 4.9 in 2022 and then jumping dramatically to 7.1 in 2023, marking a 44.9% increase in a single year.
This consistent upward trend underscores the increasing reliance on online platforms, third-party applications, and cloud services, which have expanded the attack surface for educational institutions. The number of data compromises increased by 42.77% in 2023 compared to 2022, indicating that educational institutions are increasingly targeted. This rise in attacks can be attributed to the sector’s often-limited cybersecurity budgets and growing reliance on third-party applications.
The impact of these breaches has also grown significantly. In 2022, approximately 2,000,000 individuals were affected by data breaches in the education sector. This number doubled to over 4,000,000 in 2023, highlighting the escalating scale of attacks. The financial implications are substantial, with 49% of higher education institutions reporting they paid over $5 million in data breach litigation costs in 2023. Moreover, the average cost of a data breach in the education sector, while slightly decreasing, still stood at a significant $3.48 million in 2023.
Interestingly, the most recent data for 1H 2024 shows a sharp decline in the Risk Score to 3.2, compared to 7.1 in 1H 2023 and 5.3 in 1H 2022. This recent drop suggests either fewer impactful breaches or improved security measures in the most recent period. However, given the volatile nature of the sector’s cybersecurity landscape, as evidenced by the fluctuating victims per compromise ratios over the years, it’s crucial to view this improvement cautiously.
Despite the recent positive trend, education institutions continue to be attractive targets for cybercriminals. The wealth of personal information stored within their systems, combined with the sector’s increasing digitalization, makes it essential for educational institutions to sustain and build upon recent security improvements. To mitigate ongoing risks, the sector should prioritize improving data governance, reducing the number of communication tools in use, and investing in comprehensive cybersecurity training for staff and students.
Financial Services
The financial services sector has seen a gradual but significant rise in its Risk Score over the six-year period, reflecting its position as a top target for cybercriminals. In 2018, the Risk Score was 5.5, rising steadily to 6.0 in 2020 and 6.1 in 2022, before surging to 8.4 in 2023. This consistent increase mirrors the sector’s growing reliance on digital financial services and its exposure to sophisticated cyberattacks targeting high-value assets.
The number of data compromises in the industry grew significantly by 63.84% from 2022 to 2023, with 744 incidents reported in 2023. The impact of these breaches has been substantial, with the number of victims skyrocketing to 61 million in 2023, up from 27 million in 2022. This massive increase underscores the growing sophistication of cyberattacks and the sector’s vulnerability due to its dependence on third-party vendors.
The average cost of a data breach in financial services rose to $5.56 million in 2023, reflecting the high stakes involved in protecting financial data. Despite these concerning trends, recent half-year data shows some improvement. The sector recorded Risk Scores of 7.4 in 1H 2022, 6.8 in 1H 2023, and 5.9 in 1H 2024, indicating a slight downward trend. However, the financial services sector remains highly exposed due to the nature of its operations and the potential for significant monetary losses.
To mitigate these risks, financial institutions must continue to invest in robust security infrastructure, enhance vendor risk management, and ensure compliance with global data protection regulations. The sector’s recent improvements suggest that increased focus on cybersecurity measures may be yielding positive results, but ongoing vigilance is crucial given the sector’s attractiveness to cybercriminals.
Government
The government sector has experienced one of the sharpest increases in Risk Score among all industries. In 2019, the Risk Score stood at 4.0, but it rose dramatically to 7.8 in 2023, reflecting a 95% increase over this period. This surge is largely attributed to the growing threat of nation-state cyberattacks and politically motivated incidents, particularly those targeting national security systems and legacy infrastructure.
The rise in data compromises has been equally concerning, with a 31.43% increase from 2022 to 2023, resulting in 105 incidents reported in 2023. The impact of these breaches has been severe, with the number of victims jumping from 1 million in 2022 to 10 million in 2023, a tenfold increase that highlights the growing scope and sophistication of attacks on government entities.
Half-year data reveals significant fluctuations in the sector’s Risk Score. It rose sharply from 4.1 in 1H 2022 to 8.2 in 1H 2023, before declining to 6.7 in 1H 2024. These variations underscore the volatile nature of cybersecurity threats facing government organizations and the ongoing challenges in maintaining consistent security measures.
The average cost of a data breach in the government sector was $4.88 million in 2023, reflecting the substantial financial implications of these incidents. Government agencies have become prime targets for cybercriminals due to their reliance on outdated systems, legacy infrastructure, and extensive third-party networks. To combat these rising threats, governments must prioritize the modernization of legacy systems, adopt zero-trust frameworks, and enhance collaboration between public and private sectors to fortify defenses against future attacks.
Hospitality
The hospitality sector has displayed one of the most dramatic changes in Risk Score among all industries, particularly in recent years. From 2018 to 2023, the sector’s Risk Score rose steadily from 4.5 to 7.4, a 64.4% increase reflecting growing vulnerability to cyber threats. However, the most striking changes occurred in the last two years, with the Risk Score jumping from 3.5 in 1H 2022 to 4.3 in 1H 2023, and then skyrocketing to 10.0 in 1H 2024, a 185% increase in just two years.
This trend is mirrored in the number of data compromises, which rose from 20 incidents in 2018 to 67 in 2023, a 235% increase. The number of victims grew correspondingly, from 1 million to 3 million over the same period. Interestingly, the victims per compromise ratio have remained relatively stable, hovering around 50,000 to 70,000, suggesting that while attacks have become more frequent, their individual scale hasn’t grown proportionally.
The substantial increase in both Risk Score and incidents reflects the sector’s growing vulnerability, likely driven by increasing reliance on customer data for booking and payment systems. The sharp rise, particularly in 1H 2024, could be linked to the rapid adoption of digital services and remote operations in response to changing consumer behaviors. While these advancements have improved customer experience, they’ve also widened the attack surface for cybercriminals.
Given these trends, hospitality organizations must prioritize cybersecurity more than ever, focusing on enhancing data protection measures, particularly for customer information and payment systems. As the sector continues to innovate and digitize, it must ensure that cybersecurity measures keep pace with these advancements. The dramatic rise in Risk Score from 2022 to 2024 serves as a wake-up call, highlighting the urgent need for improved cybersecurity practices to protect against growing threats.
Manufacturing
The manufacturing sector has experienced a significant surge in its cybersecurity Risk Score in recent years. While specific data for 2018-2022 is not provided, the sector has seen a dramatic increase in its Risk Score, rising from 3.7 in 1H 2022 to 3.9 in 1H 2023, and then sharply to 8.6 in 1H 2024. This represents a 132% increase over just two years, indicating a rapidly evolving threat landscape for the manufacturing industry.
The sharp increase in Risk Score aligns with a growing number of compromises and victims per compromise, suggesting that the sector is facing increasingly severe and frequent cyberattacks. This trend is likely driven by the rise in digital manufacturing technologies, such as smart factories and connected supply chains, which have expanded the attack surface for potential cybersecurity threats.
Breaches in the manufacturing sector can have far-reaching consequences, potentially disrupting production lines, compromising supply chains, and exposing valuable intellectual property. The impact of such breaches extends beyond immediate financial losses, potentially affecting product quality, delivery timelines, and even public safety in some cases.
The significant jump in the Risk Score underscores the importance of integrating robust cybersecurity measures within manufacturing operations. As the sector continues to embrace Industry 4.0 technologies, including Internet of Things (IoT) devices, artificial intelligence, and cloud computing, it must also evolve its approach to cybersecurity. Manufacturers should focus on securing their increasingly complex IT infrastructures, implementing strong access controls, and regularly assessing and updating their cybersecurity protocols to protect against increasingly sophisticated threats.
Professional Services
The professional services sector has seen notable fluctuations in its cybersecurity risk profile over recent years. While specific data for 2018-2022 is not provided, the sector’s Risk Score has shown significant changes in recent half-year periods. The Risk Score stood at 5.6 in 1H 2022, rose to 6.9 in 1H 2023, and then dropped considerably to 3.5 in 1H 2024.
This recent decline in Risk Score suggests that the sector has made considerable strides in managing its cybersecurity risks, possibly through the implementation of better incident detection and response mechanisms. However, it’s important to note that the victims per compromise in 1H 2023 was notably high, indicating that while there may have been fewer breaches, their impact remained substantial.
The improvements seen in 1H 2024 suggest that the sector has likely focused on reducing the impact of breaches, potentially through improved data protection practices and more robust security protocols. This positive trend is encouraging, but the sector must remain vigilant. The nature of professional services work—handling confidential and sensitive client data—continues to make it an attractive target for attackers.
Despite the recent improvement in Risk Score, professional services firms should continue to prioritize data protection, especially given their role in managing sensitive information for multiple clients. The sector should focus on maintaining and enhancing its cybersecurity measures, including robust encryption practices, regular security audits, and comprehensive employee training programs. As the threat landscape continues to evolve, ongoing investment in cybersecurity will be crucial to maintain the positive trend observed in recent data.
Retail
The retail sector has experienced significant fluctuations in its cybersecurity Risk Score over the past six years. The Risk Score peaked at 6.0 in 2021 before dropping to 3.5 in 2022, then rebounding to 6.2 in 2023. This variability reflects the sector’s changing approach to cybersecurity, particularly as it adapts to increased e-commerce activity and evolving payment system vulnerabilities.
Recent half-year data shows a concerning upward trend, with the Risk Score rising from 3.8 in 1H 2022 to 6.1 in 1H 2023, and reaching 9.1 in 1H 2024. This represents a 139% increase over two years, highlighting the growing threat to the retail sector, particularly in the context of e-commerce and digital transactions.
The number of data compromises in retail has shown a consistent increase, growing by 47.90% from 2022 to 2023, with 167 incidents reported in 2023, up from 87 incidents in 2022. Over the past five years, the number of compromises has fluctuated, peaking at 130 incidents in 2021 before declining in 2022 and rising again in 2023.
Interestingly, while the number of breaches increased, the number of victims saw a substantial drop from 249 million in 2022 to 65 million in 2023. This could indicate that while attacks are becoming more frequent, their scale in terms of exposed records may be more limited, possibly due to improved containment measures.
The average cost of a data breach in retail was $2.55 million in 2023, reflecting the financial burden associated with these incidents. Retailers are particularly vulnerable due to the high volume of financial transactions they handle and their dependence on third-party vendors. To mitigate these risks, the sector must prioritize strengthening payment security, securing supply chains, and reducing reliance on third-party tools involved in handling customer data.
Technology
The technology sector has maintained a relatively steady rise in its Risk Score over the six-year period from 2018 to 2023. Starting at 5.3 in 2018, the Risk Score reached 7.3 in 2023, representing a 37.7% increase. This gradual but consistent rise reflects the sector’s ongoing exposure to cyber risks, driven by its reliance on cloud services, the threat of intellectual property theft, and the potential for critical infrastructure breaches.
Interestingly, recent half-year data shows a sharp decline in the Risk Score, dropping from 8.3 in 1H 2022 to 7.6 in 1H 2023, and further down to 3.8 in 1H 2024. This downward trend is notable, especially given the sector’s critical role in global infrastructure and its position at the forefront of technological innovation.
The number of data compromises in technology has remained relatively stable in recent years, with 71 incidents reported in 2023, similar to the 70 incidents in 2022. This stability extends back to previous years, with 60 incidents reported in 2021 and 55 in 2020. While the number of victims was lower compared to other sectors, with 222,000 individuals affected in 2023, the sensitive nature of data involved, such as intellectual property and proprietary information, makes even small-scale breaches highly impactful.
The average cost of a data breach in the technology sector was $5.29 million in 2023, reflecting the high value of the intellectual property and critical infrastructure often involved. Despite the recent improvement in Risk Score, the sector faces ongoing challenges due to its role in managing vast amounts of sensitive data and its position as a prime target for sophisticated cyberattacks.
To mitigate these risks, technology firms must continue to prioritize enhancing cloud security, strengthening encryption protocols, and implementing robust access controls to protect high-value intellectual property. The sector’s ability to innovate in cybersecurity will be crucial in maintaining the positive trend observed in recent Risk Score data.
Utilities
The utilities sector has experienced moderate but consistent growth in its cybersecurity Risk Score over the past five years. The Risk Score increased from 4.0 in 2019 to 6.9 in 2023, representing a 72.5% increase. This rise reflects the sector’s growing vulnerability to cyberattacks, particularly those targeting critical infrastructure such as power grids and water systems.
While half-year data for 1H 2022 and 1H 2023 is not available, the utilities sector emerges as a significant area of concern in 1H 2024. During this period, there were 34 reported data compromises affecting 1,566,546 victims. The Victims per Compromise ratio of 46,075 is particularly alarming, indicating that when breaches occur in this sector, they tend to impact many individuals. The number of data compromises in the utilities sector has remained relatively low compared to other industries, with 53 incidents reported in 2023, compared to 60 incidents in both 2021 and 2020. However, the number of victims has shown an upward trend, rising to 297,000 in 2023, up from 280,000 in 2021 and 260,000 in 2020.
The financial impact of data breaches in the utilities sector is substantial. The average cost of a data breach in utilities was $5.10 million in 2023, a slight increase from $4.82 million in 2022. This high cost reflects the critical nature of utility services and the potential for widespread disruption in case of a major breach.
The utilities sector faces significant challenges in securing legacy infrastructure and managing risks associated with external vendors, which are integral to operations. Many utilities continue to use outdated systems that are vulnerable to sophisticated attacks from both cybercriminals and nation-state actors.
To address these growing risks, utilities must focus on modernizing their infrastructure, implementing stronger cybersecurity protocols, and enhancing collaboration with government agencies. Prioritizing the security of operational technology (OT) systems, improving incident response capabilities, and strengthening supply chain security are crucial steps in protecting this critical sector from evolving cyber threats.
Overarching Insights and Takeaways
Persistent Growth in Cyber Risk Across Industries
From 2018 to 2023, all sectors experienced a steady increase in their Risk Scores, reflecting the expanding complexity of cyber threats and their widespread impact. The average Risk Score across industries rose to 7.2 in 2023, up from 5.9 in 2022, marking an 18% increase. This growth indicates not just more frequent attacks, but a significant escalation in the severity and operational impact of breaches, including greater financial losses, reputational damage, and increased regulatory scrutiny.
The period between 2019 and 2020 saw a particularly sharp rise in the overall number of incidents across sectors, highlighting how the sudden shift to remote work and accelerated digital transformation made industries more vulnerable to cyber threats. This trend continued into subsequent years, with various sectors showing notable increases in their Risk Scores:
- Education: The Risk Score jumped from 4.9 in 2022 to 7.1 in 2023, a 44.9% increase, reflecting the sector’s growing reliance on digital learning platforms and online resources.
- Financial Services: The sector saw its Risk Score rise from 6.1 in 2022 to 8.4 in 2023, a 37.7% increase, underscoring the ongoing targeting of high-value financial assets and sensitive customer data.
- Healthcare: With a Risk Score increase from 5.0 in 2018 to 8.1 in 2023, this sector faced a 62% rise over five years, highlighting the growing vulnerability of digital health systems and the high value of medical data to cybercriminals.
- Government: Experiencing one of the sharpest increases, the government sector’s Risk Score rose from 4.0 in 2019 to 7.8 in 2023, a 95% increase, reflecting the escalating threats from nation-state actors and the challenges of securing legacy systems.
The persistent growth in cyber risk is further evidenced by the increasing scale and impact of data breaches. For instance, the total number of data compromises showed a consistent upward trend, with a 92.29% increase from the first half of 2022 to the first half of 2024. Even more striking is the exponential growth in the total number of victims affected by these compromises, with a staggering 1639.75% increase over the same period.
The persistent growth in cyber risk also reflects the evolving nature of cyber threats. Attackers are becoming more sophisticated, leveraging advanced technologies like AI and machine learning to bypass traditional security measures. Additionally, the expanding attack surface due to the proliferation of IoT devices, cloud services, and remote work environments has created new vulnerabilities that cybercriminals are quick to exploit.
As industries continue to digitize and interconnect their operations, the trend of increasing cyber risk is likely to persist. This underscores the urgent need for organizations across all sectors to not only bolster their cybersecurity defenses but also to adopt a proactive, risk-based approach to security that can adapt to the rapidly changing threat landscape.
Data Compromises vs. Victims: Understanding the Fluctuations
Over the past six years, the relationship between data compromises and the number of victims has fluctuated dramatically across industries. This trend is exemplified in several sectors:
- Retail: In 2023, the sector saw 167 data compromises, up from 87 in 2022. However, the number of victims dropped sharply from 249 million to 65 million. This fluctuation suggests improved breach containment or smaller-scale attacks in 2023. The trend has not been linear; in 2020, the retail sector had 60 million victims from fewer compromises, indicating varying scales and impacts of breaches.
- Technology: The sector experienced relatively stable data compromises over the years, with 71 incidents in 2023, only slightly up from 55 incidents in 2020. However, the number of victims varied significantly, from 222,000 in 2023 to 280,000 in 2021, demonstrating how even a limited number of compromises can expose vast amounts of sensitive data.
- Healthcare: This sector stands out with a large discrepancy in the data compromise-to-victims ratio. In 2021, 350 data compromises led to 48 million victims, while in 2023, 809 data compromises resulted in 56 million victims. This suggests that attacks have become more concentrated over time, affecting larger organizations or targeting more valuable patient information.
These varying ratios highlight the importance of understanding not just the number of incidents but also their scale and the sensitivity of the data compromised. While certain sectors may see fewer breaches in some years, the breaches that do occur are often more sophisticated and have a more profound impact.
Rising Risk From Third-party Vendors: A Cross-industry Challenge
From 2018 to 2023, industries have increasingly relied on third-party vendors, significantly expanding their attack surfaces. This reliance has made it more challenging to track and secure sensitive data exchanges, leading to more complex and far-reaching breaches. Key findings include:
- Financial Services and Technology: 66% of financial institutions and 65% of technology companies reported exchanging sensitive content with more than 1,000 external vendors. This represents a consistent risk increase from previous years.
- Government: Nearly 30% of agencies reported exchanging data with 5,000 or more third parties, a rate significantly higher than other industries. This massive external data exchange network poses a substantial risk, particularly as government organizations struggle to modernize legacy systems that are frequently targeted by nation-state actors.
- Overall Trend: The percentage of breaches attributed to third-party vendors has steadily risen from 2018 to 2023. According to Verizon, the percentage of data breaches tied to third parties increased by 68% last year, comprising 15% of all data breaches.
This trend underscores the growing need for stronger vendor oversight and more robust third-party risk management strategies across all industries.
Recommendations and Takeaways
As the cybersecurity landscape evolves, the Risk Score methodology presents transformative opportunities across various domains. This section explores compelling future applications that leverage this standardized approach to risk assessment, offering a vision of more secure, compliant, and intelligent cyber ecosystems.
- Predictive Risk Modeling and AI-enhanced Threat Intelligence
The historical data accumulated through Risk Score assessments opens exciting possibilior predictive modeling. By developing advanced time series models and integrating AI and machine-learning technologies, we can project future Risk Scores and identify emerging threats with unprecedented accuracy. This approach could lead to the creation of dynamic early warning systems, allowing organizations to proactively address cybersecurity risks before they materialize.
Imagine an AI-driven system that continuously analyzes global threat intelligence feeds, correlates this data with organization-specific Risk Scores, and generates real-time, actionable insights. Such a system could simulate potential attack scenarios, assess their impact on Risk Scores, and recommend tailored mitigation strategies, providing a truly responsive and forward-looking risk assessment framework.
- Revolutionizing Regulatory Compliance and Reporting
The Risk Score has the potential to become a universal metric for cybersecurity risk disclosure, creating a standardized language for communicating risk across industries. This standardization could lead to more efficient and effective regulatory oversight, with real-time Risk Score monitoring enabling a proactive approach to cybersecurity governance.
Envision a centralized dashboard used by regulatory bodies to monitor Risk Scores across industries in real time. This system could automatically flag organizations exceeding risk thresholds, trigger targeted audits, and even suggest policy interventions based on emerging trends. For organizations, this could mean streamlined compliance processes, with automated reporting tools generating regulatory filings based on their Risk Score data.
- Strategic Planning and Resource Allocation
The Risk Score methodology offers a quantifiable basis for strategic cybersecurity decisions. Organizations could develop sophisticated ROI models for security investments that incorporate projected impacts on Risk Scores. This approach enables data-driven budget allocation, ensuring resources are directed to areas with the greatest potential for risk reduction.
Consider a dynamic budget allocation tool that adjusts cybersecurity spending in real time based on fluctuations in Risk Score components. Such a tool could optimize resource distribution across different security initiatives, balancing immediate threats with long-term risk reduction strategies.
- Benchmarking, Performance Improvement, and Collaborative Defense
By establishing industry-specific Risk Score benchmarks, organizations can gain a clear understanding of their relative security posture. This approach fosters a culture of continuous improvement and enables the development of best practice guidelines based on top-performing organizations.
Picture an industry-wide collaboration platform where organizations anonymously share their Risk Score data and successful risk reduction strategies. This ecosystem could drive collective improvement in cybersecurity practices, with AI-powered analytics identifying industry-wide trends and suggesting collaborative defense strategies.
- Transforming Cyber Insurance and M&A Processes
In the realm of cyber insurance, the Risk Score could enable more accurate and dynamic risk assessment and pricing models. Insurers could offer personalized, usage-based policies that adjust premiums in real time based on an organization’s current Risk Score.
For mergers and acquisitions, the Risk Score could provide a standardized method for assessing cybersecurity liabilities. Imagine an M&A due diligence process that uses AI to project post-merger Risk Scores, enabling more informed decisions and fair valuations that account for cybersecurity risks.
- Enhanced Third-party Risk Management and Secure Communications
As organizations increasingly rely on complex networks of vendors and partners, the Risk Score methodology could revolutionize third-party risk management. Envision a supply chain management system that continuously monitors the Risk Scores of all vendors, automatically adjusting access privileges and implementing additional security measures when a partner’s risk level changes.
For sensitive communications, imagine an intelligent system that dynamically adjusts security protocols based on the Risk Scores of the participants and the sensitivity of the content. This could enable more secure and efficient information sharing, particularly in high-risk industries like healthcare and finance.
- Navigating Complex Regulatory Landscapes
As data privacy and security regulations proliferate, the Risk Score could become a crucial tool for ensuring and demonstrating compliance. Picture a dynamic compliance dashboard that maps Risk Score components to specific regulatory requirements across multiple jurisdictions, providing real-time visibility into an organization’s global compliance posture.
This system could automatically calculate potential fines based on current Risk Scores, offer tailored recommendations for addressing compliance gaps, and even predict the impact of proposed regulations on an organization’s risk profile.
- Secure Collaboration in the Age of AI
The rise of generative AI and large language models presents new challenges for data security, which an evolved Risk Score methodology could address. Imagine an intelligent file-sharing platform that automatically assigns Risk Scores to documents based on their content, intended recipients, and potential AI interactions. This system could enforce dynamic access controls and encryption levels, ensuring sensitive content is protected from unintended AI ingestion while still enabling productive collaboration.
Furthermore, AI-specific Risk Score components could help organizations assess and mitigate the unique risks associated with AI systems processing sensitive information. This could lead to the development of AI auditing tools that provide detailed insights into potential data leakage risks and recommend mitigation strategies, ensuring organizations can leverage AI capabilities without compromising data security.
By embracing these future applications of the Risk Score methodology, organizations can move toward a more proactive, intelligent, and collaborative approach to cybersecurity, better equipped to face the evolving challenges of our digital world.
Concluding Thoughts
The cybersecurity landscape is evolving at an unprecedented pace, with data breaches becoming more frequent, sophisticated, and devastating across all sectors. Our analysis, leveraging the innovative Risk Score methodology, has unveiled critical insights into this dynamic threat environment:
- A consistent upward trend in cyber risk across industries, with the average Risk Score rising 18% from 2022 to 2023.
- Dramatic fluctuations in the relationship between data compromises and victim counts, highlighting the increasing complexity of cyberattacks.
- A growing vulnerability stemming from increased reliance on third-party vendors, with some sectors exchanging sensitive data with over 5,000 external parties.
The Risk Score methodology stands as a powerful tool in our collective defense against cyber threats. By providing a standardized, quantifiable measure of cybersecurity risk, it enables meaningful comparisons across sectors and time, facilitating more informed decision-making and resource allocation.
As we navigate the digital frontier, the Risk Score’s potential applications—from predictive modeling to regulatory compliance and AI-enhanced security—offer a roadmap for a more secure future. However, realizing this potential requires a concerted effort from all stakeholders: industry leaders must champion its adoption, policymakers should consider its integration into regulatory frameworks, and cybersecurity professionals must continually refine its accuracy and relevance.
In an era where digital resilience is paramount, the Risk Score methodology is more than a metric—it’s a call to action. By embracing this approach, we can collectively build a more secure, transparent, and resilient digital ecosystem. The challenges are significant but armed with the insights provided by the Risk Score, we are better equipped than ever to face the cybersecurity threats of tomorrow.
Appendix
Additional Risk Score Tables
| Sector | 1H 2024 vs. 1H 2023 | 1H 2023 vs. 1H 2022 | 1H 2024 vs. 1H 2022 |
|---|---|---|---|
| Total | 13.68% | 69.16% | 92.29% |
| Education | -5.00% | 95.12% | 85.37% |
| Financial Services | 67.49% | 89.84% | 217.97% |
| Government | 48.00% | 51.52% | 124.24% |
| Healthcare | -37.40% | 135.63% | 47.50% |
| Hospitality | 43.48% | 109.09% | 200.00% |
| Manufacturing | 34.82% | -2.61% | 31.30% |
| Professional Services | 29.93% | 45.74% | 89.36% |
| Retail | -19.30% | 90.00% | 53.33% |
| Technology | -24.14% | 180.65% | 112.90% |
| Transportation | 50.00% | 89.47% | 184.21% |
| Utilities | 33.00% | n/a | n/a |
Table 12: 1H 2024, 2023, and 2022 Percent Change in Data Compromises.
| Sector | 2023 vs. 2022 | 2022 vs. 2021 | 2021 vs. 2020 | 2020 vs. 2019 | 2019 vs. 2018 |
|---|---|---|---|---|---|
| Overall | 49.67% | -18.31% | 11.55% | 13.19% | 12.80% |
| Education | 42.77% | -51.52% | 16.67% | 20.00% | 10.00% |
| Financial Services | 63.84% | 21.93% | 11.90% | 18.92% | 20.00% |
| Government | 31.43% | -31.94% | 5.26% | 5.56% | 5.88% |
| Healthcare | 57.60% | -2.04% | 17.14% | 13.79% | 12.00% |
| Hospitality | 49.25% | -2.94% | 14.29% | 16.67% | 20.00% |
| Manufacturing | 3.86% | 11.65% | 6.82% | 7.32% | 5.26% |
| Professional Services | 27.60% | -41.26% | 7.94% | 13.79% | 20.00% |
| Retail | 47.90% | -49.43% | 3.85% | 12.00% | 9.09% |
| Technology | n/a | n/a | 8.33% | 9.09% | 10.00% |
| Utilities | n/a | n/a | 25.00% | 11.11% | 12.50% |
Table 13: 2023 – 2018 Data Compromises Increase/Decrease.
| Sector | 1H 2024 vs. 1H 2023 | 1H 2023 vs. 1H 2022 | 1H 2024 vs. 1H 2022 |
|---|---|---|---|
| Total | 490.76% | 194.50% | 1,639.75% |
| Education | -56.39% | 308.59% | 78.17% |
| Financial Services | -31.52% | 84.52% | 26.36% |
| Government | -15.37% | 1,266.90% | 1,056.87% |
| Healthcare | 7.43% | 90.63% | 104.80% |
| Hospitality | 131,622.36% | 450.87% | 725,515.53% |
| Manufacturing | 3,552.53% | 181.46% | 10,180.24% |
| Professional Services | -90.24% | 287.24% | -62.19% |
| Retail | 6,151.75% | 1,786.95% | 117,867.32% |
| Technology | -73.85% | 95.90% | -48.78% |
| Transportation | -84.94% | 1,219.18% | 98.62% |
| Utilities | -22.86% | n/a | n/a |
Table 14: 1H 2024, 2023, and 2022 Percent Change in Victims.
| Sector | 1H 2024 vs. 1H 2023 | 1H 2023 vs. 1H 2022 | 1H 2024 vs. 1H 2022 |
|---|---|---|---|
| Total | 419.69% | 74.10% | 804.76% |
| Education | -54.10% | 109.40% | -3.88% |
| Financial Services | -59.11% | -2.80% | -60.26% |
| Government | -42.81% | 802.16% | 415.90% |
| Healthcare | 71.62% | -19.10% | 38.85% |
| Hospitality | 91,706.49% | 163.46% | 241,771.84% |
| Manufacturing | 2,609.16% | 188.99% | 7,729.32% |
| Professional Services | -92.48% | 165.70% | -80.03% |
| Retail | 7,646.73% | 893.13% | 76,935.21% |
| Technology | -65.53% | -30.20% | -75.94% |
| Transportation | -89.96% | 596.23% | -30.11% |
| Utilities | -35.87% | n/a | n/a |
Table 15: 1H 2024, 2023, and 2022 Victims per Compromise Increase/Decrease.
| Sector | 2023 vs. 2022 | 2022 vs. 2021 | 2021 vs. 2020 | 2020 vs. 2019 | 2019 vs. 2018 |
|---|---|---|---|---|---|
| Overall | -240.47% | 56.50% | -0.89% | -1.92% | -1.48% |
| Education | 12.62% | 1.00% | 0.00% | 0.00% | 16.67% |
| Financial Services | -22.42% | -137.21% | -2.16% | -9.63% | -9.37% |
| Government | 85.42% | -506.31% | 7.64% | 9.24% | 11.46% |
| Healthcare | -17.93% | -68.00% | -5.60% | -4.95% | -7.66% |
| Hospitality | 1.48% | -61.90% | 6.67% | 10.00% | 16.67% |
| Manufacturing | -399.28% | 29.26% | 6.99% | 8.70% | 13.64% |
| Professional Services | 72.38% | -135.98% | 2.24% | 3.33% | 0.00% |
| Retail | -635.33% | 83.87% | 4.67% | 3.31% | 1.00% |
| Technology | n/a | n/a | 1.80% | 8.34% | 3.70% |
| Utilities | n/a | n/a | -23.81% | -3.84% | -4.77% |
Table 16: 2023 – 2018 Victims per Data Compromise Increase/Decrease.
| Sector | 2024 vs. 2023 | 2023 vs. 2022 | 2022 vs. 2021 | 2021 vs. 2020 | 2020 vs. 2019 | 2019 vs. 2018 |
|---|---|---|---|---|---|---|
| Overall | 8.81% | 2.25% | 2.53% | 8.96% | -1.55% | 1.53% |
| Education | -4.29% | -5.75% | 1.81% | -2.90% | -22.31% | 65.20% |
| Financial Services | 2.96% | -1.19% | 4.19% | -2.27% | -0.17% | 64.85% |
| Government | -1.96% | 20.38% | 6.76% | 44.04% | -19.44% | 41.86% |
| Healthcare | -11.87% | 7.59% | 8.61% | 22.75% | 9.54% | 36.74% |
| Hospitality | 4.97% | 19.01% | 30.95% | 15.27% | -15.70% | 39.70% |
| Manufacturing | 14.93% | 5.50% | 5.15% | -17.69% | -4.21% | 70.77% |
| Pharmaceuticals | 5.49% | -3.94% | -0.60% | -0.40% | -2.77% | 66.54% |
| Professional Services | 12.01% | -5.15% | 1.06% | 9.03% | -9.22% | 60.82% |
| Retail | 14.94% | -10.81% | 0.30% | 38.53% | 8.46% | 36.96% |
| Technology | 14.50% | -6.65% | 1.81% | -3.28% | -0.20% | 66.34% |
| Transportation | 5.64% | 14.11% | -4.46% | 4.53% | -5.31% | 66.05% |
| Utilities | 9.64% | 1.26% | 1.48% | -37.42% | 12.36% | 70.18% |
Table 17: 2024 – 2018 Cost of a Data Breach Increase/Decrease.
| Sector | 1H 2024 vs. 1H 2022 | 1H 2024 vs. 1H 2023 | 1H 2024 vs. 1H 2022 |
|---|---|---|---|
| Total | 17.74% | 10.61% | 6.45% |
| Education | -39.62% | -54.93% | 33.96% |
| Financial Services | -20.27% | -13.24% | -8.11% |
| Government | 63.41% | -18.29% | 100.00% |
| Healthcare | -19.40% | -15.63% | -4.48% |
| Hospitality | 185.71% | 132.56% | 22.86% |
| Manufacturing | 132.43% | 120.51% | 5.41% |
| Professional Services | -37.50% | -49.28% | 23.21% |
| Retail | 139.47% | 49.18% | 60.53% |
| Technology | -54.22% | -50.00% | -8.43% |
| Transportation | -49.15% | -58.90% | 23.73% |
| Utilities | n/a | n/a | n/a |
Table 18: 1H 2024, 1H 2023, and 1H 2022 Risk Score Increase/Decrease.
| Sector | 2023 vs. 2022 | 2022 vs. 2021 | 2021 vs. 2020 | 2020 vs. 2019 | 2019 vs. 2018 |
|---|---|---|---|---|---|
| Overall | +21.67% | -3.23% | +14.81% | +1.89% | +3.92% |
| Education | +44.00% | -1.96% | +6.25% | -11.11% | +17.39% |
| Financial Services | +37.10% | +34.78% | -23.33% | -6.25% | +10.34% |
| Government | +97.50% | -36.51% | +14.55% | +14.58% | +9.09% |
| Healthcare | +51.85% | +8.00% | -26.47% | +15.25% | +11.32% |
| Hospitality | +42.31% | -10.34% | +13.73% | +4.08% | +8.89% |
| Manufacturing | +18.37% | +28.95% | 11.63% | -6.52% | -8.00% |
| Professional Services | +33.33% | -29.69% | +23.08% | -10.34% | +7.41% |
| Retail | +75.00% | -50.00% | +26.32% | +7.55% | +8.16% |
| Technology | +29.82% | +7.55% | +8.16% | -5.77% | +10.64% |
| Transportation | +15.52% | +5.45% | +3.77% | -5.36% | +16.67% |
| Utilities | +62.79% | -10.42% | +20.00% | -28.57% | +9.80% |
Table 19: 2023 – 2018 Risk Scores Across Industries Increase/Decrease.
Legal Disclaimer:
This research report includes findings derived with the assistance of algorithmic analysis and artificial intelligence (AI) technologies. Please note the following:
Experimental Nature: The AI and algorithmic methods used in this research are experimental. While we have made efforts to ensure accuracy, we cannot guarantee the complete reliability or efficacy of these technologies.
Not Professional Advice: The findings presented in this report do not constitute professional, legal, financial, or any other form of expert advice. Readers should not rely solely on these results for making important decisions.
Potential for Errors: Despite our best efforts, the AI and algorithms used may contain errors, biases, or inaccuracies. The results should be interpreted with caution and verified independently where critical.
Limitations of AI: The AI systems used have inherent limitations and may not account for all variables or specific circumstances relevant to individual cases.
Human Oversight: While AI and algorithms were utilized, human researchers have reviewed and interpreted the results. However, this does not guarantee the absence of errors or biases.
No Liability: We disclaim all liability for any losses, damages, or consequences that may arise from the use or misuse of the information presented in this report.
Continuous Development: AI and algorithmic technologies are rapidly evolving. The methods used in this research may be subject to future improvements or revisions.
By accessing and using this research report, you acknowledge that you have read, understood, and agreed to these terms and conditions.
References
- Ani Petrosyan, “Annual number of data compromises and individuals impacted in the United States from 2005 to 2023,” Statista, accessed September 9, 2024.
- Bert Kundress,”MOVEit hack victim list,” KonBriefing, December 20, 2023.
- “2024 Data Breach Investigations Report,” Verizon, May 2024.
- “2023 Data Breach Report,” Identity Theft Resource Center, January 2024.
- “2024 Cost of a Data Breach Report,” IBM and Ponemon Institute, July 2024.
- James Coker, “Ransomware Attack Demands Reach a Staggering $5.2M in 2024,” Infosecurity Magazine, July 2, 2024.
- “How MFA Failures Are Fueling a 500% Surge in Ransomware Losses,” The Hacker News, July 2, 2024.
- “66% of consumers would not trust a company following a data breach,” Security Magazine, July 5, 2024.
- “2024 Sensitive Content Communications Privacy and Compliance Report,” Kiteworks, June 2024.
- Luke Fischer, “Identifying global privacy laws, relevant DPAs,” IAPP, March 19, 2024.
- “2024 Cost of a Data Breach Report,” IBM and Ponemon Institute, July 2024.